
3 Ways to Create Flowcharts & Graphs on Shopify For Free
Shopify designs should never be boring. It’s a disappointment that people never go around making generic themes their own by adding animations, designs, unique and original text, layouts, and other elements to them.
Please stop designing generic stores. Following this, I will show you how to add graphs, flowcharts and other shapes to your Shopify store so instead of uploading weird images, or writing AI text no one will read, you have something a visitor will actually pay attention to.
I see this constantly with product setup guides, comparison pages, order process explainers, and FAQ pages. A customer reads three paragraphs trying to understand a process that a single flowchart could explain in five seconds.
In this blog, I discuss three free ways to create flowcharts and get them onto your Shopify store, along with how to actually publish or embed them once they are built.
Why Flowcharts Actually Help Your Shopify Store
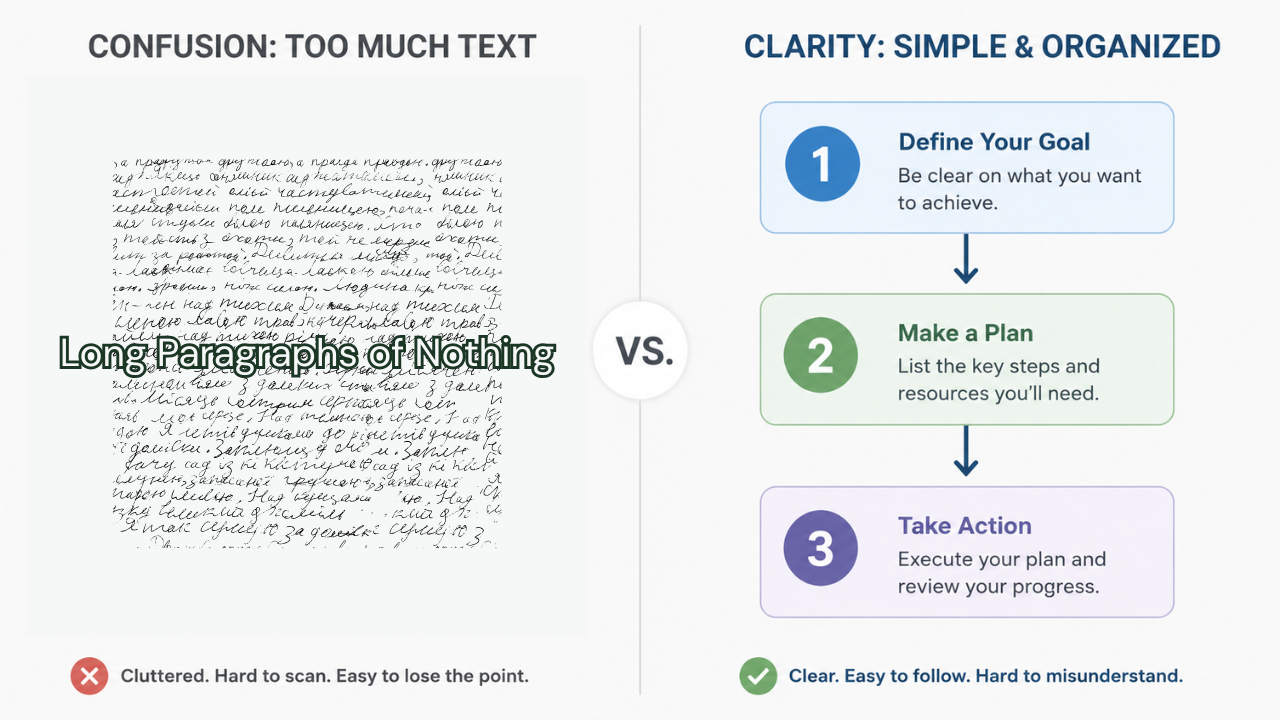
Before jumping into the methods, it is worth being clear on when a flowchart actually earns its place on a page.
Visual aids like diagrams and flow charts are known to improve content retention among users. When you present information visually instead of as another block of text, visitors understand it faster and remember it longer. That matters for pages people actually need to reference again later, like return policies or setup instructions.
A well organized page with clear visuals can also elevate how professional your store looks. Visitors associate diagrams and structured visuals with thorough research and real expertise, and that builds trust faster than plain paragraphs do.
Good places to use a flowchart on a Shopify store:
- Order fulfillment process pages (how an order moves from checkout to delivery)
- Return and exchange policy pages
- Product setup or assembly guides
- Size or fit decision guides
- Subscription flow explainers
- Warranty claim processes
- FAQ pages with branching logic (“if this, then this”)
Now let us look at three free ways to actually build one.
Method 1: Using Canva Quick Flow for Shopify
If you already use Canva for your store’s graphics, this is the fastest route by far.
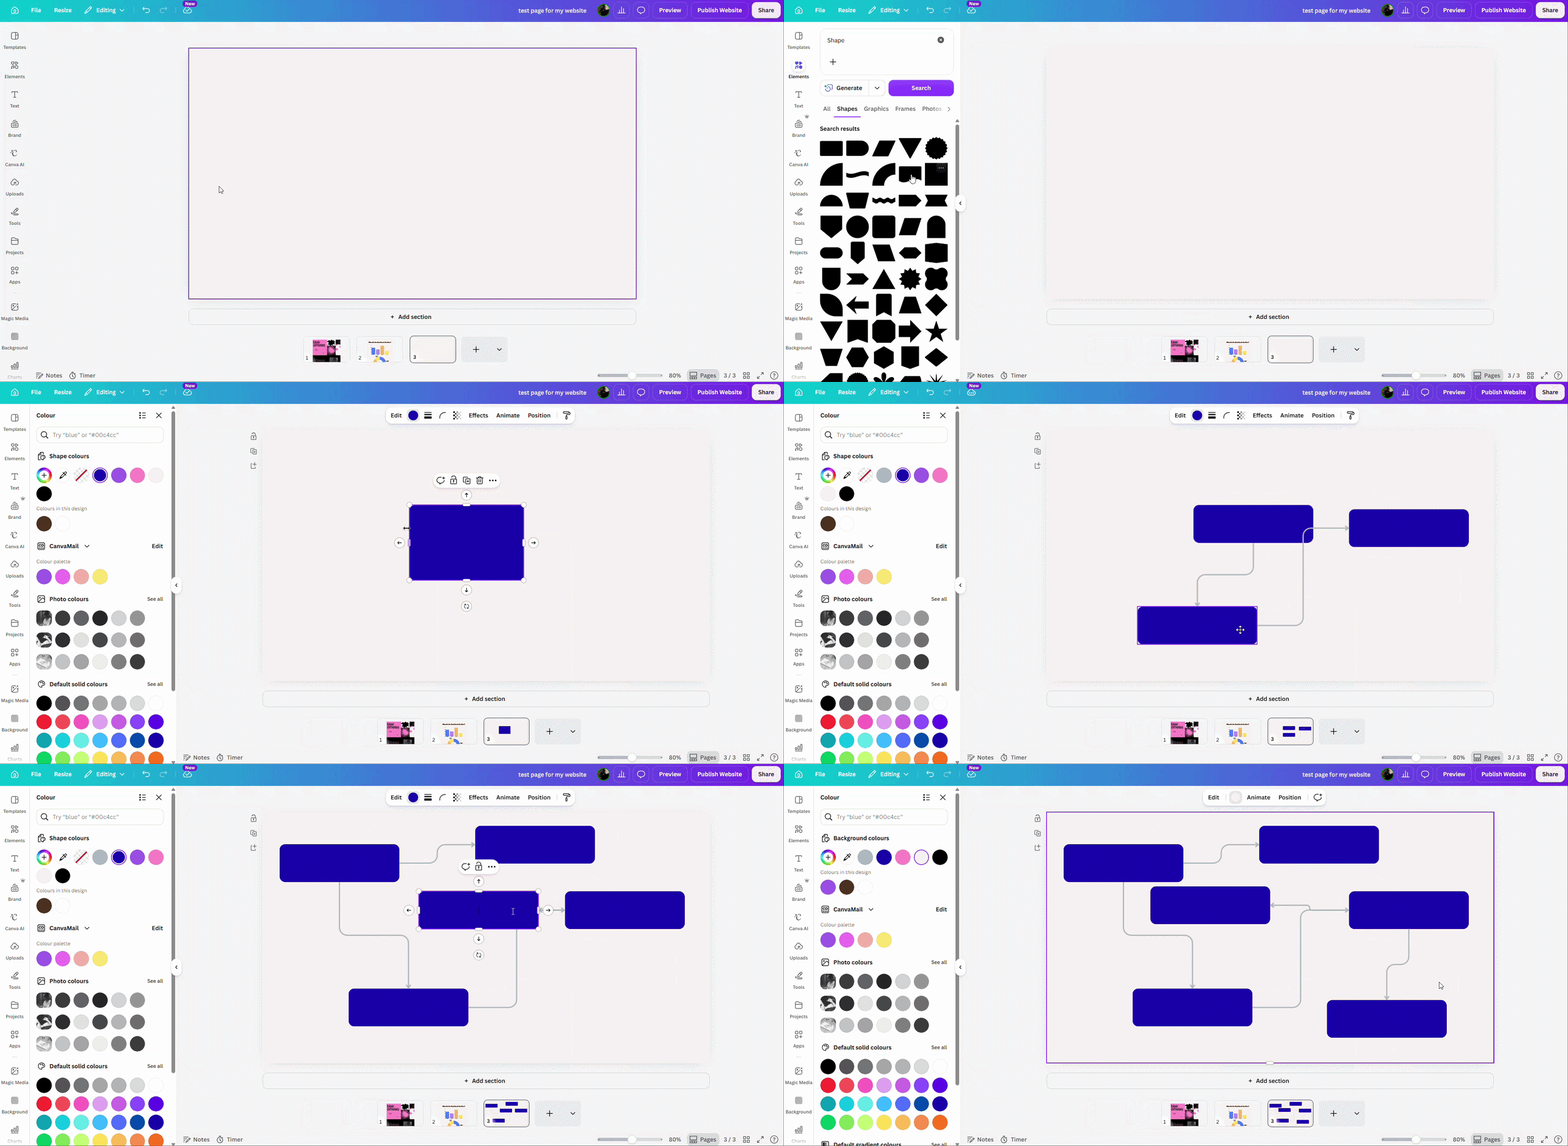
Quick Flow is a built-in Canva feature that helps you build flowcharts faster by auto adding connected shapes and lines.
Here is how it works in practice. Right click any shape and select Enable Quick Flow. Small directional arrows appear around that shape. Hover over one of those arrows and a preview of the next shape appears. Click it. Canva places a new connected shape automatically. Resize, and adjust it.
The shapes and lines stay connected as you build out the rest of your flow, so if you move one shape later, the connector lines follow it. You can also drag an arrow manually toward another existing shape until it snaps into place.
We’ve explained how to bring it to Shopify at the end of this blog.
Method 2: Canva Charts Section (Graphs and Data Visuals)
Flowcharts are great for showing steps and decisions. But if what you actually need is a bar chart, pie chart, or comparison graph, Canva has a completely separate section built for that.
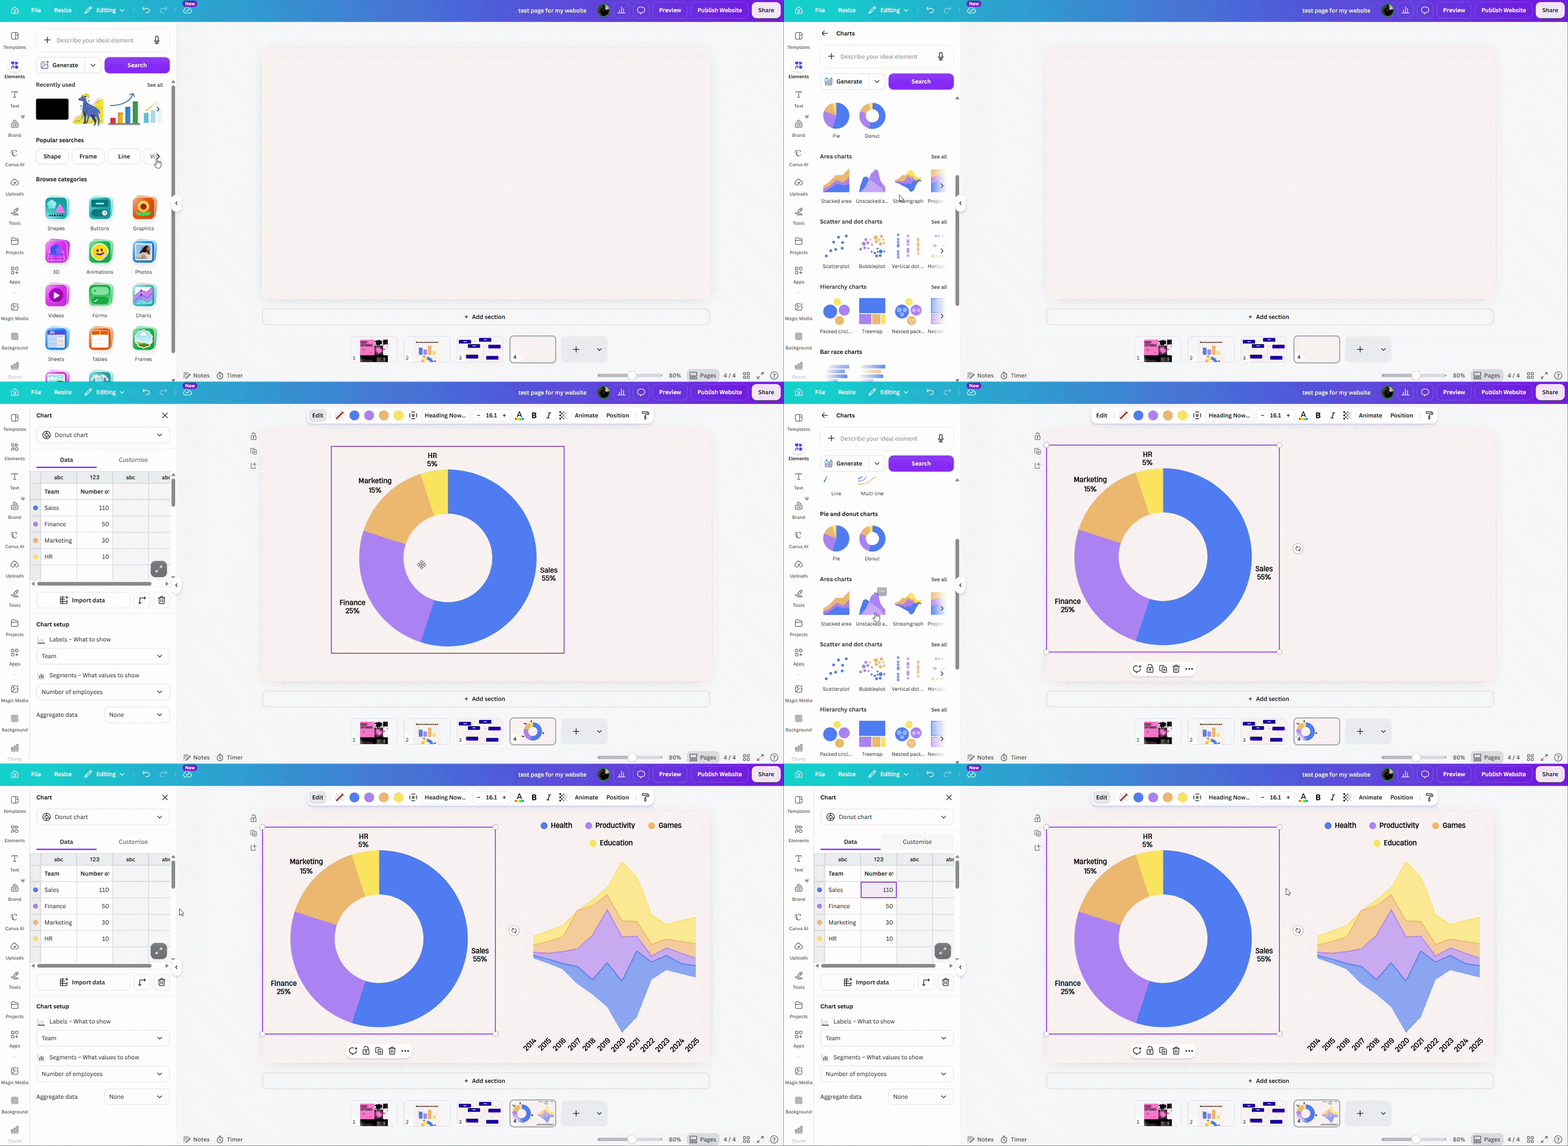
Inside the Canva editor, go to elements and search “Charts”. Canva will show you a complete directory of pre-built chart templates. Canva’s chart tools let you build bar charts, pie charts, line graphs, and other data visuals, and you can plug in your own numbers directly into an editable data table behind each chart.
This is the method I recommend for:
- Comparing shipping speeds across regions
- Showing product size or pricing tiers visually
- Displaying customer satisfaction or review breakdowns
- Illustrating before and after results (weight loss products, skincare timelines, fitness programs)
- Seasonal sales data or year over year growth visuals on an About page
Method 3: Shopify Chart Apps or Third Party Integrations
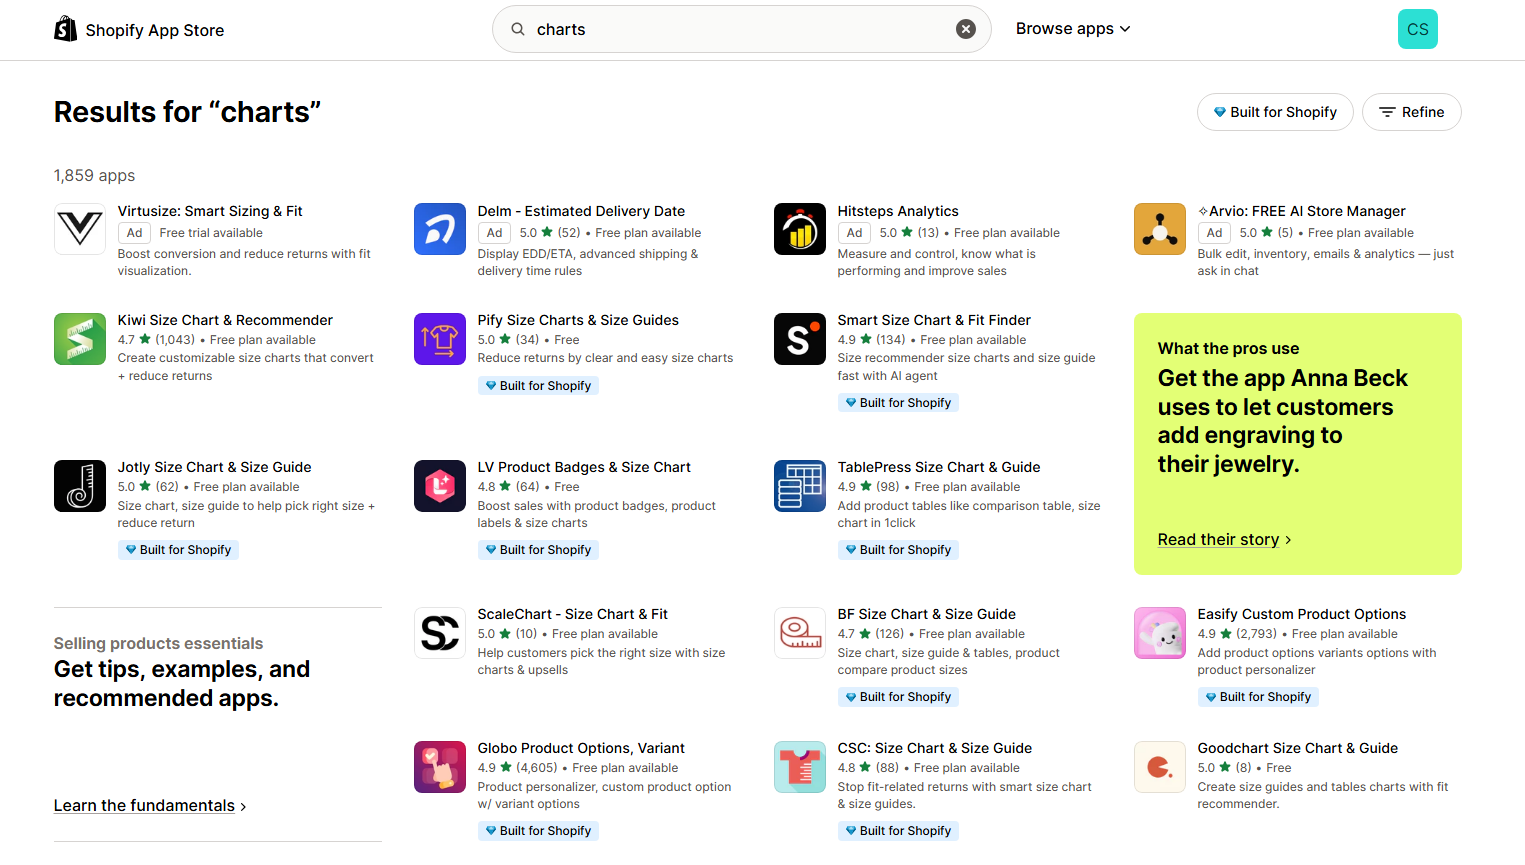
There are not many Shopify apps for flowcharts and pie charts. Most of the apps only focus on product size charts (mostly clothing).
The alternative is to use Figma and other chart platforms, and integrate them to Shopify somehow (we will talk about it in the next section).
The tradeoff with this method is that it lacks freedom of design, and has a slightly more technical setup resistance. If you already prefer designing visually in Canva, methods one and two combined with a proper import method will usually give you more creative control.
How to Actually Get Your Flowchart Live on Shopify
There are two practical routes here, and which one you pick depends on how you want the flowchart to behave.
Option A: Import as a Native Shopify Page with Canvify
If you want your flowchart to become a real Shopify page, not a floating widget stuck inside an iframe, this is the better route.
Canvify takes the design you built in Canva and converts it directly into a native Shopify section. That means it becomes real HTML that Shopify treats like any other section of your store. It is not a screenshot or an embedded frame.
You can: Design the complete landing page with Canva that has the flowcharts and graphs in it Just design the flowcharts & graphs section in between an already built landing page.
Tutorials for both ways are linked in the text above.
If you want a starting point instead of designing from scratch, Canvify’s template library has layouts built specifically for Shopify pages that you can customize with your own flowchart or chart content.
Option B: Embed as an Iframe with EmbedAny
If instead you just want to drop a single flowchart or chart into an existing product page, blog post, or FAQ section and make it interactive, embedding is the simpler option.
Embedding your Canva charts as iframe on Shopify is less common and looks less polished than a built-in page section like method 1.
EmbedAny lets you embed content from external platforms by pasting a URL, without writing any iframe code yourself. If your flowchart lives on a shareable Canva link, a whiteboard tool, or another hosted diagram source, you paste that link into EmbedAny and it renders as an embedded iframe directly inside your existing Shopify page or blog post.
Which One Should You Use
If the flowchart is the centerpiece of a dedicated page, like a full “How Shipping Works” page or a branded product education page, publish it natively with Canvify. If it is a supporting visual dropped into an existing blog post or FAQ, embed it with EmbedAny.
Many stores end up using both. Full pages get published through Canvify. Smaller, standalone diagrams referenced inside existing content get embedded through EmbedAny.
Start simple. Pick one page on your store that currently explains a process in three paragraphs of text, rebuild that explanation as a flowchart in Canva, and publish it through Canvify or embed it with EmbedAny depending on the page. You will likely notice customers spending more time on that page and asking fewer repeat questions in support.
FAQs
How do I create a free flowchart for my shopify store?
Use Canva’s Quick Flow feature to build a flowchart by connecting shapes with automatic arrows and alignment. It is free, requires no design experience, and works in any Canva design type except Canva Docs. Once built, publish it to Shopify as a native page or embed it into an existing page.
What is canva quick flow and how does it work?
Quick Flow is a built-in Canva tool that automatically adds connected shapes and lines as you build a flowchart. Right click a shape, enable Quick Flow, then hover and click directional arrows to add connected steps. It keeps spacing, alignment, and styling consistent without manual adjustment.
Can I make charts and graphs in canva for free?
Yes. Canva has a dedicated charts section supporting bar charts, pie charts, line graphs, and more. You can plug your own data into an editable table behind each chart and restyle colors and fonts to match your brand, all within the free version of Canva.
Are there shopify apps specifically for flowcharts and diagrams?
Yes. Several Shopify apps let you build interactive diagrams and flowcharts directly inside your store, with features like custom skins, animated connectors, and mobile responsive rendering. Most offer a free starting tier with paid upgrades for advanced customization.
How do I add a canva flowchart to my shopify store?
You have two main options. Publish it as a native Shopify page using Canvify, which converts your Canva design into real HTML that behaves like any other Shopify page. Or embed it as an iframe using a tool like EmbedAny if you only need the flowchart inside an existing page.
What is the difference between publishing a flowchart natively and embedding it?
A natively published page becomes real HTML on your Shopify store, which typically loads faster and indexes better for SEO. An embedded iframe pulls the content from an external source in real time, which is faster to set up for a single diagram but depends on that external source staying available.
Do flowcharts actually improve shopify conversion rates?
Flowcharts and other visual aids improve content retention and help visitors understand processes faster than plain text. Pages that explain shipping, returns, or product setup with a visual flow tend to reduce support questions and can improve trust, which supports conversion indirectly.
Is Canva or a dedicated shopify app better for building flowcharts?
Canva gives you more design flexibility and works well if you also want charts, branding consistency, and full page layouts. Dedicated Shopify diagram apps are convenient if you want something built directly into the store without leaving Shopify, though they often come with a monthly fee for advanced features.